source
get_channels_colors
 get_channels_colors (channels:pandas.core.frame.DataFrame,
                      events:pandas.core.frame.DataFrame,
                      participant_id:int=None, array_index:int=None,
                      time_range:Tuple[str,str]=None,
                      event_filter:Iterable[str]=None,
                      palette:str='muted')
source
plot_sleep_channels
 plot_sleep_channels (channels:pandas.core.frame.DataFrame,
                      x:str='collection_timestamp', y:str='values',
                      row:str='source', hue:str='channel_group',
                      participant_id:int=None, array_index:int=None,
                      time_range:Tuple[str,str]=None,
                      y_include:Iterable[str]=None,
                      y_exclude:Iterable[str]=None,
                      rename_channels:dict={'actigraph': 'Actigraph',
                      'body_position': 'Body Position', 'heart_rate':
                      'Heart Rate', 'heart_rate_raw': 'Heart Rate Raw',
                      'pat_infra': 'PAT Infra', 'pat_amplitude': 'PAT
                      Amplitude', 'pat_lpf': 'PAT LPF',
                      'respiratory_movement': 'Respiratory Mov.', 'spo2':
                      'SpO2', 'snore_db': 'Snore dB', 'pat_view': 'PAT
                      View', 'sleep_stage': 'Sleep Stage'},
                      discrete_events:Iterable[str]=['sleep_stage',
                      'body_position'], resample:str='1s',
                      color_map:pandas.core.series.Series=None,
                      palette:str='muted', fig:pheno_utils.timeseries_plot
                      s.TimeSeriesFigure=None,
                      ax:List[matplotlib.axes._axes.Axes]=None, height=1,
                      **kwargs)
plot channels data for a given participant and array_index
source
plot_sleep
 plot_sleep (events:pandas.core.frame.DataFrame,
             channels:pandas.core.frame.DataFrame,
             participant_id:int=None, array_index:int=None,
             time_range:Tuple[str,str]=None,
             event_filter:Iterable[str]=None,
             channel_filter:Iterable[str]=['actigraph', 'pat_infra',
             'body_position', 'snore_db', 'heart_rate', 'spo2'],
             event_height:float=1, channel_height:float=0.5,
             padding:float=-0.02, figsize:Tuple[float,float]=None,
             palette:str='muted')
*Plot sleep events and channels data.
Args:
events (pd.DataFrame): The sleep events dataframe.
channels (pd.DataFrame): The sleep channels dataframe.
participant_id (int): The participant id to filter the data.
array_index (int): The array index to filter the data.
time_range (Tuple[str, str]): The time range to filter the data.
event_filter (Iterable[str]): The events to include in the plot.
channel_filter (Iterable[str]): The channels to include in the plot.
event_height (float): The relative height of the events subplot.
channel_height (float): The relative height of each channel's subplot.
padding (float): The padding between subplots.
figsize (Tuple[float, float]): The size of the figure.
palette (str): The color palette to use.
Returns:
TimeSeriesFigure: The figure with the sleep events and channels data.*source
get_sleep_period
get_sleep_period (events:pandas.core.frame.DataFrame)
*Get the sleep period from the sleep events dataframe.
Args:
events (pd.DataFrame): The sleep events dataframe.Returns:
pd.DataFrame: The sleep period dataframe.*
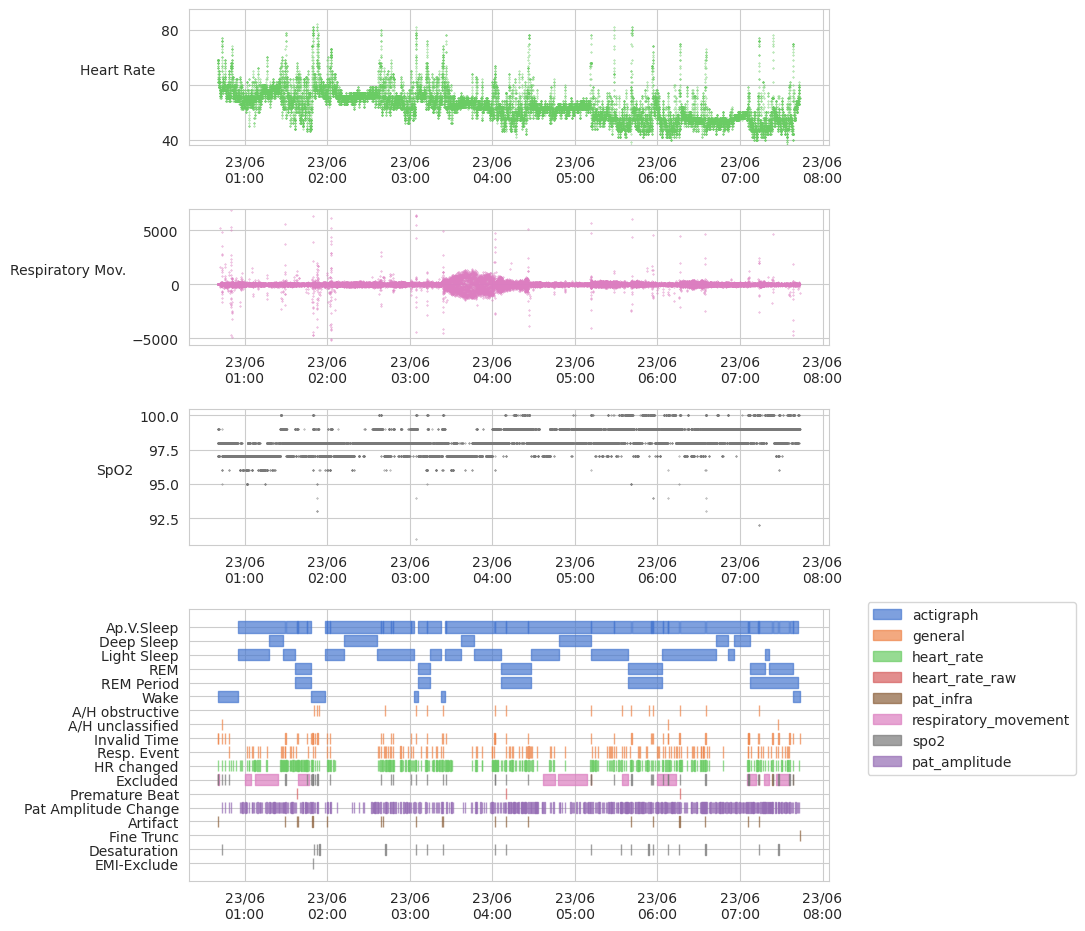
How to plot sleep events and channels
This module provides functions for plotting sleep events and channels data.
First, we will load time series DFs from the sleep monitoring dataset.
from pheno_utils import PhenoLoader= PhenoLoader('sleep' )= pl.load_bulk_data('channels_time_series' ) # contains: heart_rate, spo2, respiratory_movement = pl.load_bulk_data('events_time_series' )
/home/ec2-user/projects/pheno-utils/pheno_utils/pheno_loader.py:610: UserWarning: No date field found
  warnings.warn(f'No date field found')
participant_id
cohort
research_stage
array_index
collection_timestamp
source
0
10k
00_00_visit
1
2020-06-23 00:40:29+03:00
heart_rate
62.0
respiratory_movement
0.0
spo2
NaN
2020-06-23 00:40:29.200000+03:00
respiratory_movement
0.0
2020-06-23 00:40:29.400000+03:00
respiratory_movement
0.0
participant_id
cohort
research_stage
array_index
collection_timestamp
0
10k
00_00_visit
1
2020-06-23 00:40:29+03:00
2020-06-23 00:40:34+03:00
Excluded
heart_rate_raw
0
5
2020-06-23 00:40:29+03:00
2020-06-23 00:40:34+03:00
Excluded
spo2
0
5
2020-06-23 00:40:29+03:00
2020-06-23 00:55:29+03:00
Wake
actigraph
0
900
2020-06-23 00:40:29+03:00
2020-06-23 00:40:34+03:00
Invalid Time
general
0
5
2020-06-23 00:40:29+03:00
2020-06-23 00:40:32+03:00
Artifact
pat_infra
0
3
import seaborn as sns'whitegrid' )= ['heart_rate' , 'spo2' , 'respiratory_movement' ],= (8 , 8 ), padding= 0.03 )