data = generate_synthetic_data(n=1000)
bland_altman_triple_plot(data=data, m1_col="val1",m2_col="val2")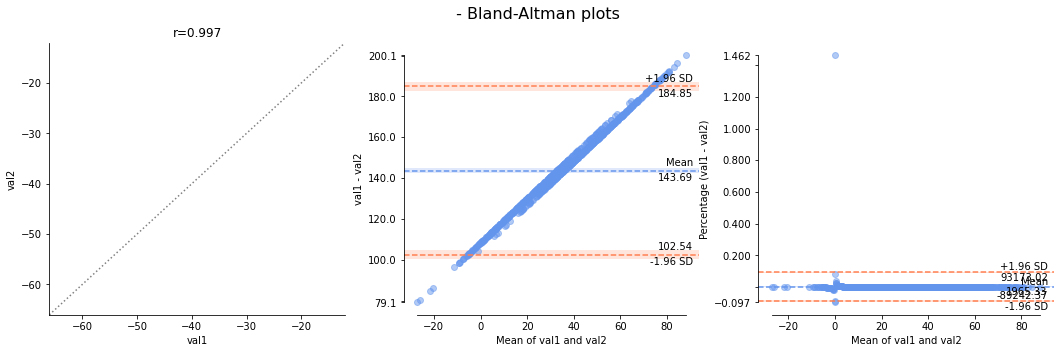
 bland_altman_triple_plot (data:pandas.core.frame.DataFrame, m1_col:str,
                           m2_col:str, feature_str:str='',
                           scale:str='linear')
*Generates a triple plot consisting of a scatter correlation plot, Bland-Altman plot, and a percentage Bland-Altman plot.
Args: data (pd.DataFrame): A pandas DataFrame containing the data. m1_col (str): The name of the first measurement column in the DataFrame. m2_col (str): The name of the second measurement column in the DataFrame. feature_str (str, optional): A string to include in the title of the plots. Defaults to ““. scale (str, optional): The scale of the axes. Defaults to”linear”.
Returns: None*
data = generate_synthetic_data(n=1000)

bland_altman_triple_plot(data=data, m1_col="val1",m2_col="val2")